This blog post shows examples of how to customize a leaflet map with javascript, html and css.
Put leaflet zoom control in lower right of map
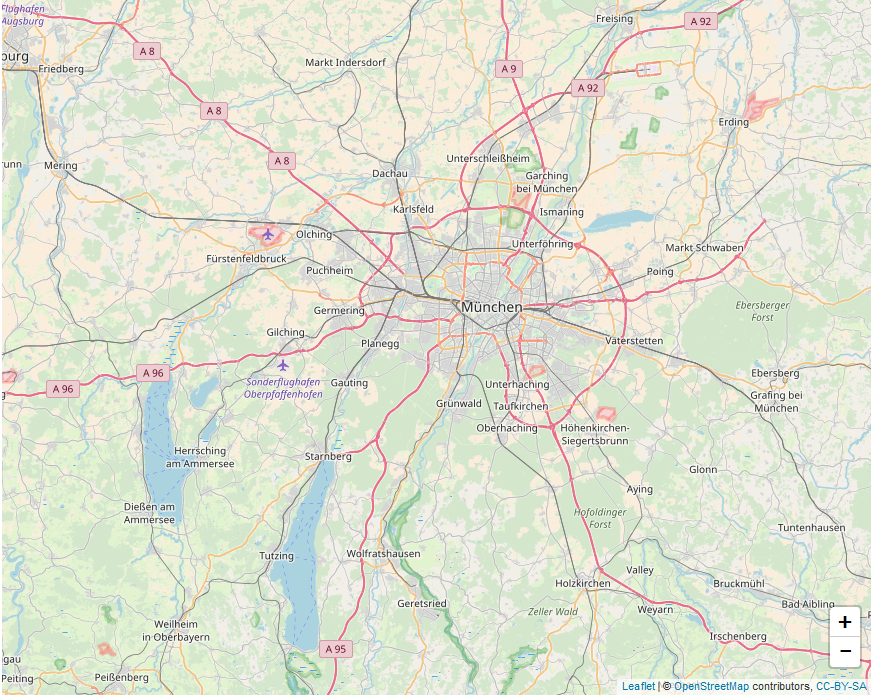
Here is a simple leaflet map in a shiny app, where we move the zoom control (+ - symbol) from the upper left to the lower right of the map. In the ui.R file we will hide the original zoom control by setting the CSS attribute visibility to hidden.
library(shiny)
library(leaflet)
library(htmlwidgets)
ui <- fluidPage(
  tags$head(
    tags$style(HTML("
      .leaflet-left .leaflet-control{
        visibility: hidden;
      }
    "))
  ),
  leafletOutput("map", width = "870px", height = "696px")
)
In the server.R we can then add a leaflet zoom control with Javascript, here we specify the position as 'bottomright'.
server <- function(input, output) {
  output$map <- renderLeaflet({
    leaflet() %>% addTiles() %>% setView(11.5, 48.1, 10) %>%
      onRender(
        "function(el, x) {
          L.control.zoom({
            position:'bottomright'
          }).addTo(this);
        }")
  })
}
shinyApp(ui, server)